
Chris Olsen
Data Analyst | Data Visualization Specialist | Process Improvement Specialist | Board Game Enthusiast | Cat Collector
Skilled in: Excel, Tableau, SQL, VBA, Power Query, Power Automate, Data Manipulation, Data Analysis, Problem Solving, cat herding, not knowing the lyrics to my favorite songs
Wingspan Board Game Data Analysis
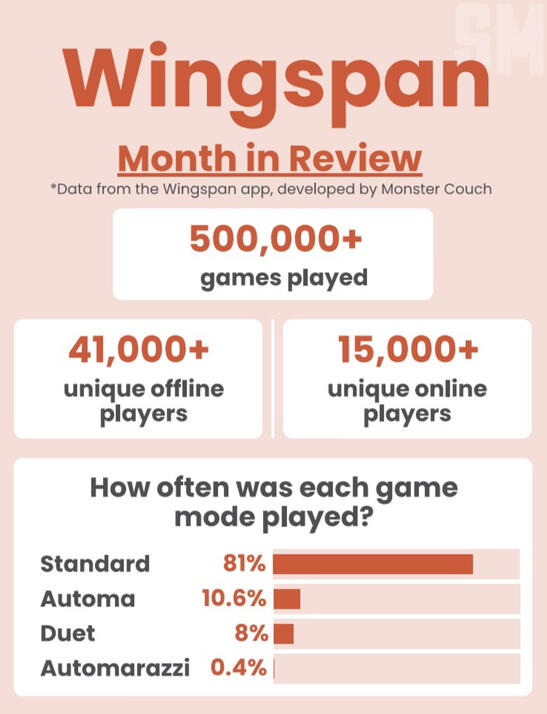
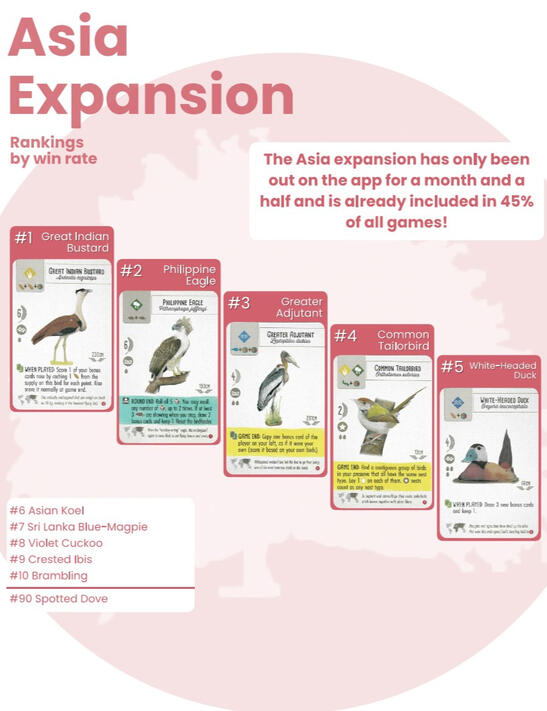
I analyzed data sent to me by board game publisher Stonemaier Games from their digital version of their hit board game Wingspan (one of my favorite games).
- I sent them an analysis of the data as well as a PDF report with some highlights to share publicly. The analysis included metrics such as win rates, expansion/expansion combination play rates, card strength implications based on multiple factors, etc.
Skills used: data cleaning, data analysis, data visualization, Power Query, Excel, statistical analysis.
Examples from the publicly-shared report:
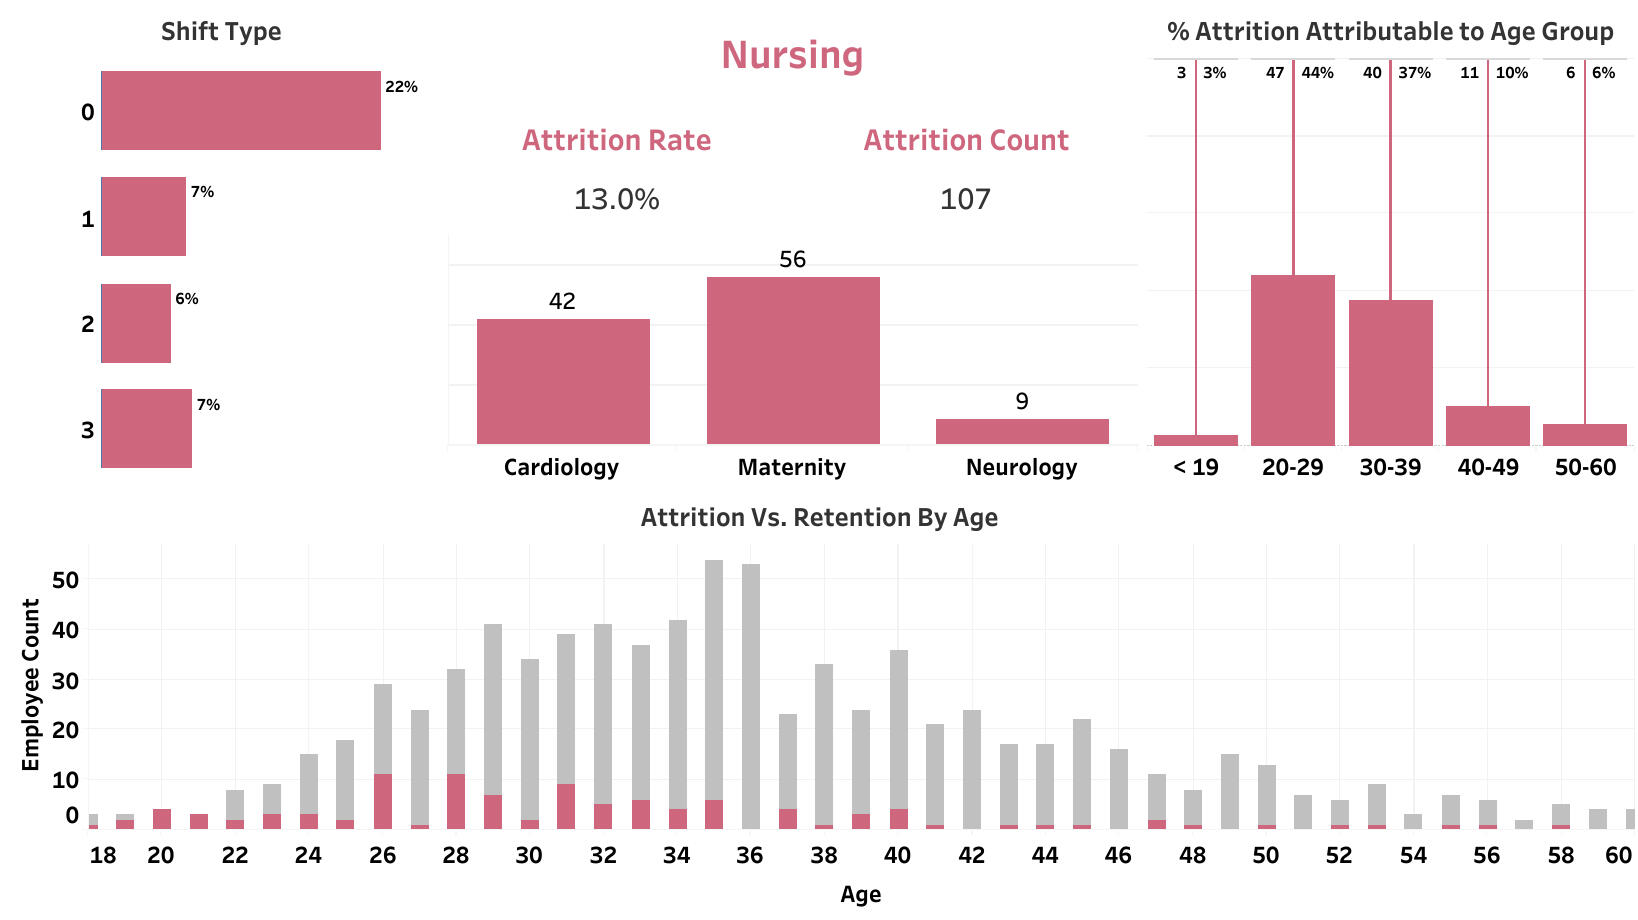
This dashboard monitors hospital nurse attrition rates by age range, job role, department, and shift type.
-This provides insights into employee groups most at risk of leaving, offering opportunities for early intervention, reducing attrition, increasing employee satisfaction, and improving patient care quality.
Pricing Tool - Excel, VBA, Outlook, Power Query
This is an old version of the tool. The newest version had slightly more functionality, was more user-friendly, and more visually appealing. I could only keep the older version, however.
I built this tool to streamline our SOP for price changes. Our suppliers would give us the SKU #s and the new prices. This tool:
-Looks up all of the relevant information and calculates % increases (following different rules for some buyers).
-Calculates what the new retail price should be if we kept the same margin (then rounds up to the nearest cent ending in 9).
-Highlights SKUs whose price has increased above a certain % threshold, and gives other warnings if certain conditions are met.
-Transforms this info to fit the template supplied by the Pricing team and saves it to a file, following a naming convention.
-Creates an Outlook email addressed to the correct people, with the correct file attached.
The buyers said they'd "needed this for 15 years."
Tools used: Excel, VBA, Outlook, Power Query.
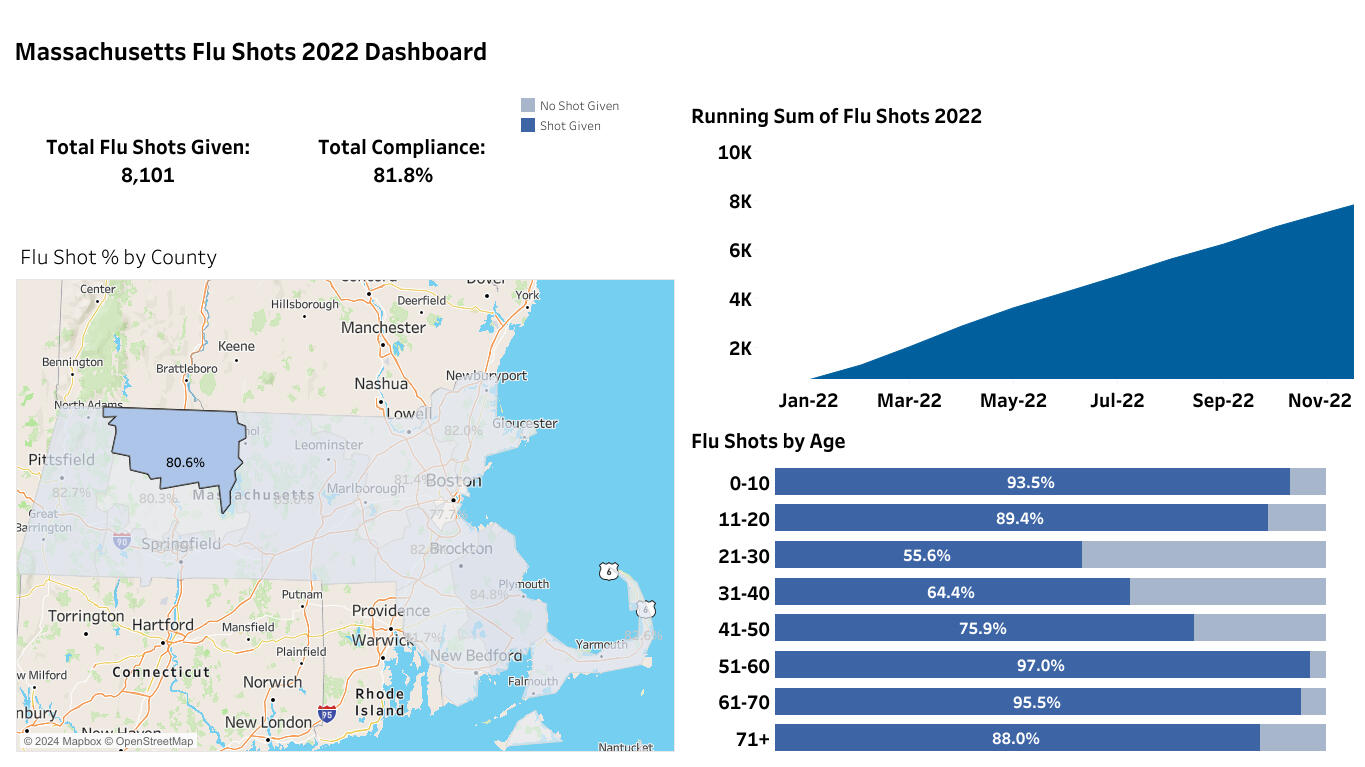
-Transformed flu shot data in SQL - Used CTEs, Joins.
-Developed to track the number and percentage of flu shots given to hospital patients, flu shot percentages by age group, and by county.
-This helps officials identify target areas for increased efforts, ultimately improving public health outcomes.
Retail Revenue Vs. Costs - Excel